Improving freight data
Previous | Table of contents | Next
Further freight data is available at the online Freight Performance Dashboard. The Dashboard provides a holistic view of Australian freight sector’s performance and, as it is tracked over time, will provide a strong foundation for measuring the success of the Strategy at a macro level.
A fundamental principle of the National Freight and Supply Chain Strategy is the importance of getting accurate, timely and comparable data to measure freight movements by mode through supply chains. Data is the critical enabler that will:
- show governments and industry where to act quickly versus where to focus longer-term efforts
- identify ways Australia lags behind our competitors or show how Australia can best use its competitive strengths in leading the way
- where current actions are yielding the best impact or if unintended consequences are arising.
For this reason, a primary goal for governments and industry this year was to improve the collection and use of national freight data.
3.1 National Freight Data Hub
Improving national freight data and establishing a National Freight Data Hub is a high priority for industry and a priority action under the National Freight and Supply Chain Strategy.
The National Freight Data Hub prototype website was launched in May 2021 as an early demonstration of the value of improved freight data. The website includes 125 datasets in the first curated and searchable national freight data catalogue.
The National Freight Data Hub prototype website provides better access to existing government data and existing freight data initiatives.
The prototype website is designed to be incrementally innovative, providing a practical and technologically advanced solution for insights into Australia’s freight system. It features interactive insights with cutting-edge geospatial visualisation tools for industry and governments to
gain a national picture of freight movements. It also showcases how to make better use of current data to answer enduring freight questions such as what freight is being moved, when, and where.
The Australian Government is investing $16.5 million in the National Freight Data Hub over four years (from 2021-22 to 2024-25). This investment will build on and improve the prototype website, and the underlying data, across all freight modes and more supply chains. This work will include:
- setting up formal data sharing agreements and technology solutions, and joining complex datasets across all modes (including rail, which was not included in the prototype work),
- providing leadership and coordination to establish data standards to make it easier to compare and exchange freight data, and
- continuing to work with data owners and custodians to generate useful insights, and answer the ‘enduring questions’ for freight, which we established in close collaboration with stakeholders during the design stage.
3.2 Freight Performance Indicators
Current performance indicators were selected in late 2019 using existing indicators that predated the Strategy’s agreement.
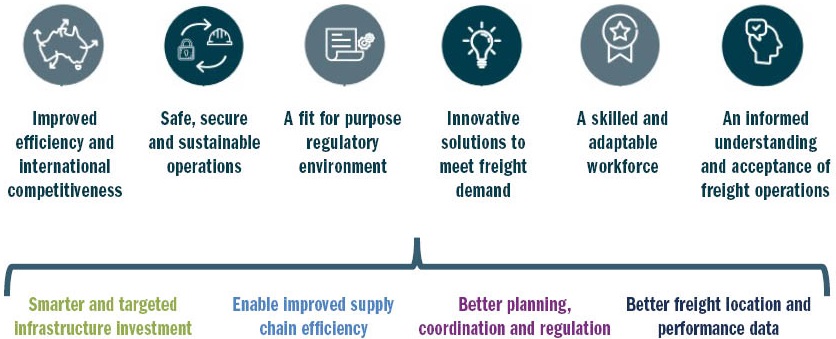
Australian governments are working to strengthen the performance monitoring framework with new indicators. The aim is to have ‘outcome indicators’ linked to the six intended outcomes under the Strategy and ‘progress indicators’ under each of the four critical action areas. These will allow us to track against ‘outputs’ and ‘outcomes’ – i.e. are we delivering what we said we’d deliver and is it getting us any closer to our ultimate goal?

The aim is to consult industry and the community more broadly in 2021-22 to ensure the measures are meaningful for industry and identify where more work needs to take place to gather and/or improve the quality of data. This will be an iterative process.
From 2021, new interim indicators will be added to the performance framework:
- Average freight-carrying truck age, as a proxy for measuring the safety of road freight vehicles
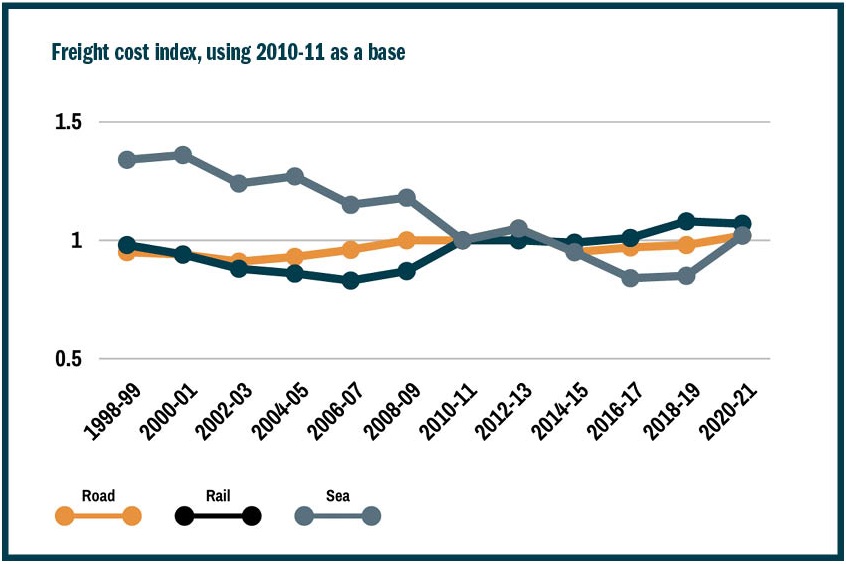
- A freight cost index across road, rail and sea
- Public sector expenditure on transport infrastructure.
While any new indicators may not have much longitudinal data at the moment, we expect to derive greater insights as the Strategy progresses and more data is gathered.
It is governments’ intention to use BITRE’s new annual series of reports based on vehicle telematics data to, over time, measure reductions in travel times along corridors.

Additional freight data
- Bureau of Infrastructure and Transport Research Economics (BITRE) freight publications
- The National Freight Data Hub prototype website
- Supply Chain Benchmarking Dashboard