Why we need action
Australia’s freight systems are the lifeblood of our economy and way of life
Each year our infrastructure operators, transport companies and logistics experts deliver about four billion tonnes of goods across Australia – that is 163 tonnes of freight for every person. Melbourne alone requires approximately 15,000 tonnes of food to be delivered every day.
Australian freight supply chains are typically vast, reflecting the size of the country, and come in many different forms. In its most basic form, a supply chain is the network of people, companies, products and services that gathers raw materials, transforms them into products and transports them to their final destination. They rely on many different actors - such as producers, transporters, customs officials, brokers and inspectors.
Freight supply chains get petrol to the service station, fresh foods to supermarket shelves, household waste to tip, construction materials on site and essential pharmaceuticals to our hospitals. They connect our agriculture regions and resource basins to cities and ports, delivering Australian produce and minerals to international markets.
Figure 2.1: The domestic freight task in Australia
Major Freight Flows in Australia (by volume per mode)
Figure 2.1 shows Australia’s domestic freight task by mode, with thicker arrows indicating greater volumes of freight, but not the value or performance of Australia’s freight and supply chains. It shows that bauxite (from Weipa to Gladstone) makes up the highest volume moved by coastal shipping, while iron ore and coal make up the highest volume task moved by rail. Iron ore and coal move across privately operated rail networks in the Pilbara, Central Queensland and Hunter Valley. These networks are usually simpler to operate than multiuser networks, being largely single use, and already near, if not at, world’s best practice.
The focus of the Strategy is on our multiuser networks, such as our interstate road and rail systems and the aviation network, that carry some of our highest value freight. As they service a much wider user base, improving our multiuser networks can have significant flow on effects to the country as a whole.
* NB: there are other key Australian freight routes not included as this map focuses solely on proportional volume, not value or number of freight movements.
Australia’s freight challenge
Our freight task keeps growing
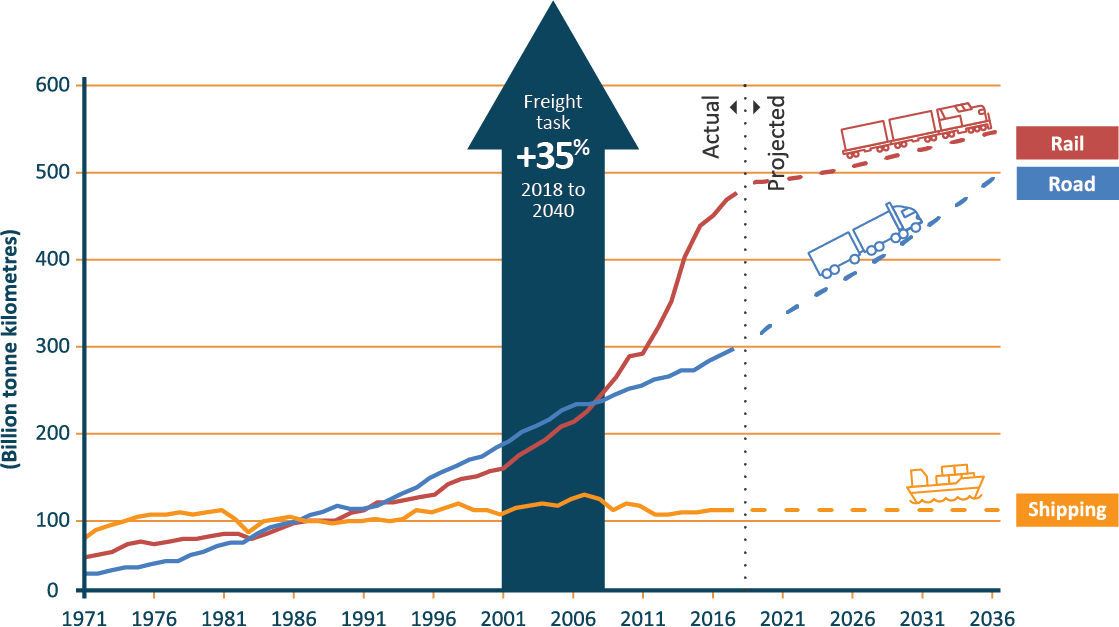
Figure 2.2: Projected freight growth by mode in Australia
As Figure 2.2 shows, bulk mineral transport from iron ore and coal mines to export ports has driven a threefold increase in the rail freight task since 2000. Road transport is the dominant form of freight for the majority of commodities produced and/or consumed in Australia. Road freight grew by over 75 per cent between 2000-01 and 2015-16. Declining domestic oil reserves and a reduction in the coastal trading fleet have resulted in a stagnation in freight volumes moved via coastal shipping.
While it only represents 0.1 per cent of freight by volume, the value of freight moved by air continues to soar (21 per cent of total international trade value). Due to the low volumes involved, airfreight is not represented in Figure 2.2.
Australia’s freight volumes are projected to continue to grow, even with reduced growth in bulk mineral exports. While Australia’s freight task is growing, freight productivity and costs have plateaued since the 1990s. Urban infrastructure is reaching capacity due to road congestion (which will be around $30 billion a year by 2030), greater noise and environmental regulation, and corridor and precinct encroachment.
Freight productivity and costs have plateaued
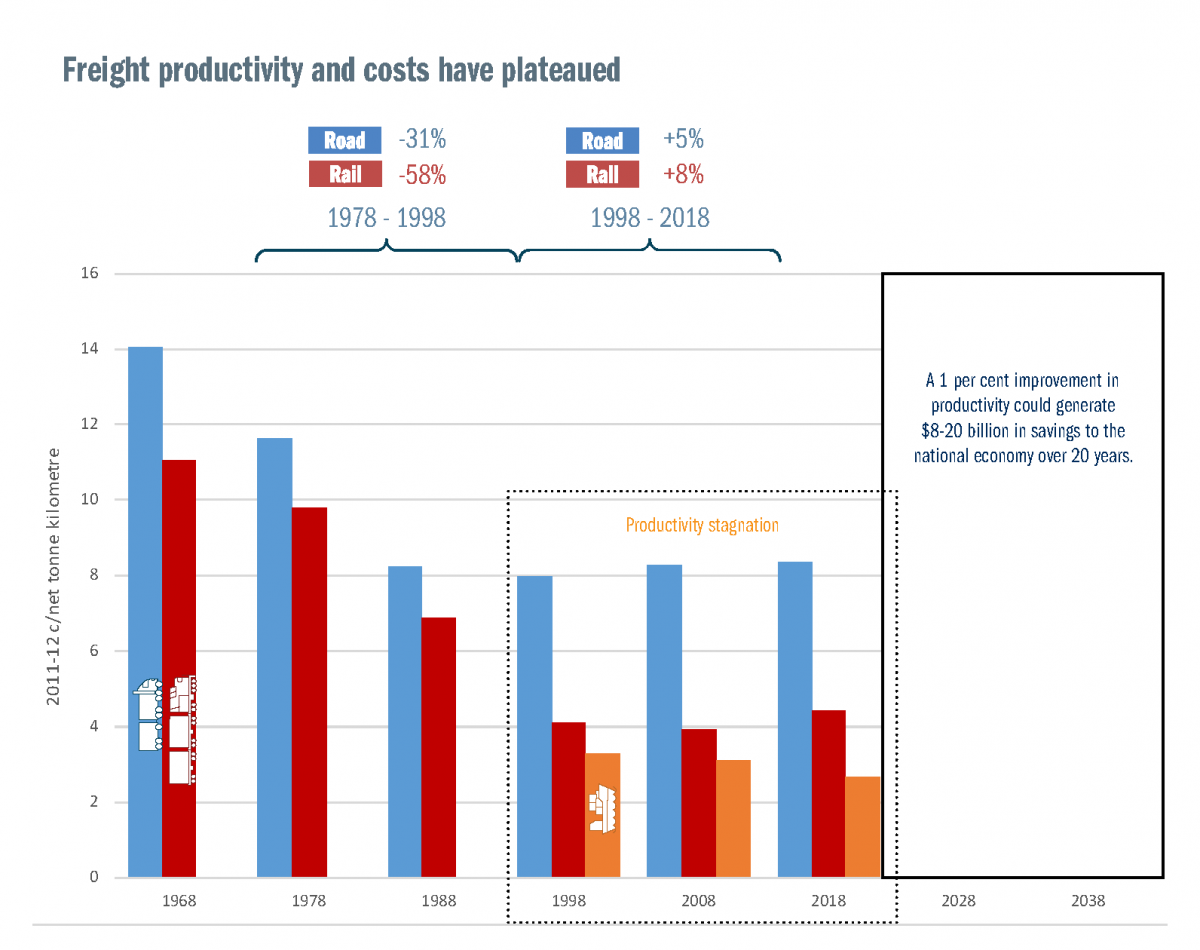
Figure 2.3: Productivity Stagnation in the Freight Sector
Australia’s freight productivity and costs have stagnated since the 1990s, when the impact of reforms such as national competition policy and the introduction of higher productivity vehicles were exhausted. Real interstate freight rates for road and rail fell by 31 per cent and 58 per cent respectively from 1978 to 1998, but have marginally increased by 5 per cent (road) and 8 per cent (rail) in the period from 1998 to 2018.
Maintaining international competitiveness will be key to meeting Asia’s rising demand for our exports, especially high quality agricultural products and minerals moving from our regions. Currently over 75 per cent of Australian exports are destined for Asia.
Business practices and new technologies are changing the nature of our freight task
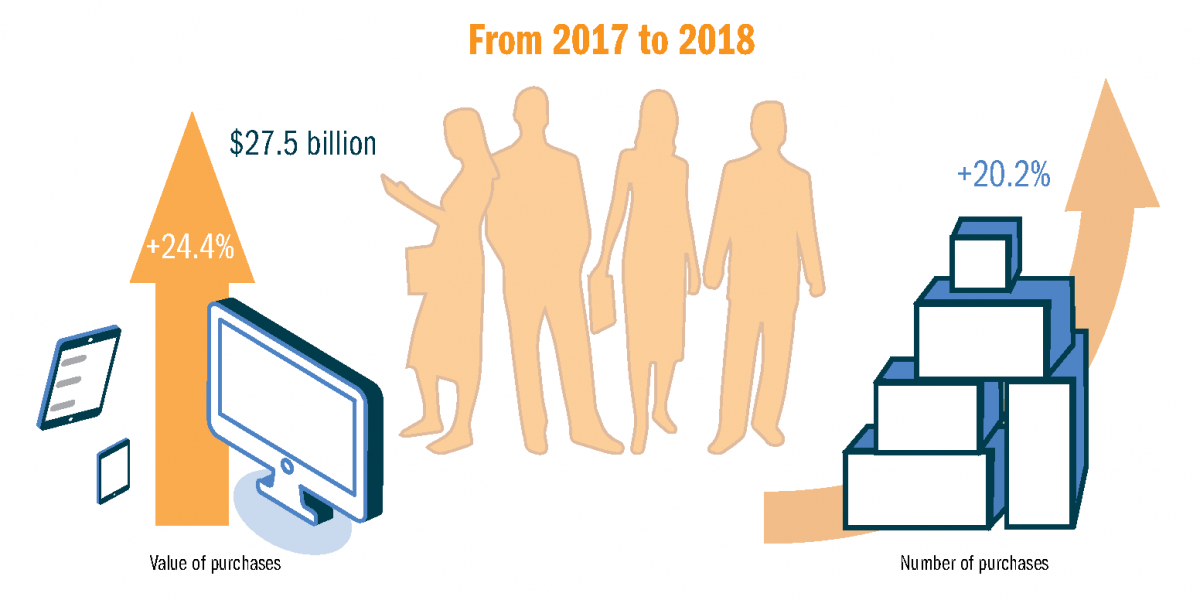
Figure 2.4: e-Commerce continues to grow due to changing consumer preferences
Top e-commerce purchasing locations by volume include the outer suburbs of Sydney and Melbourne, and regional centres such as Toowoomba, Mackay, Gosford and Bundaberg.
As people increasingly order goods online, the ‘last mile’ of the freight journey - that, is, the space between key freight corridors and precincts and the final delivery point - becomes more important. Road congestion, network issues, restrictions on access, curfews preventing 24-hour operations, and availability of parking and kerbside space in dense commercial and residential areas affect speed and convenience of delivery in the last mile.
Changing business practices and new technologies, like digitalisation, automation and electrification, have the potential to further shrink supply chains and dramatically improve freight productivity and costs.
Australia needs safe, secure and resilient freight systems
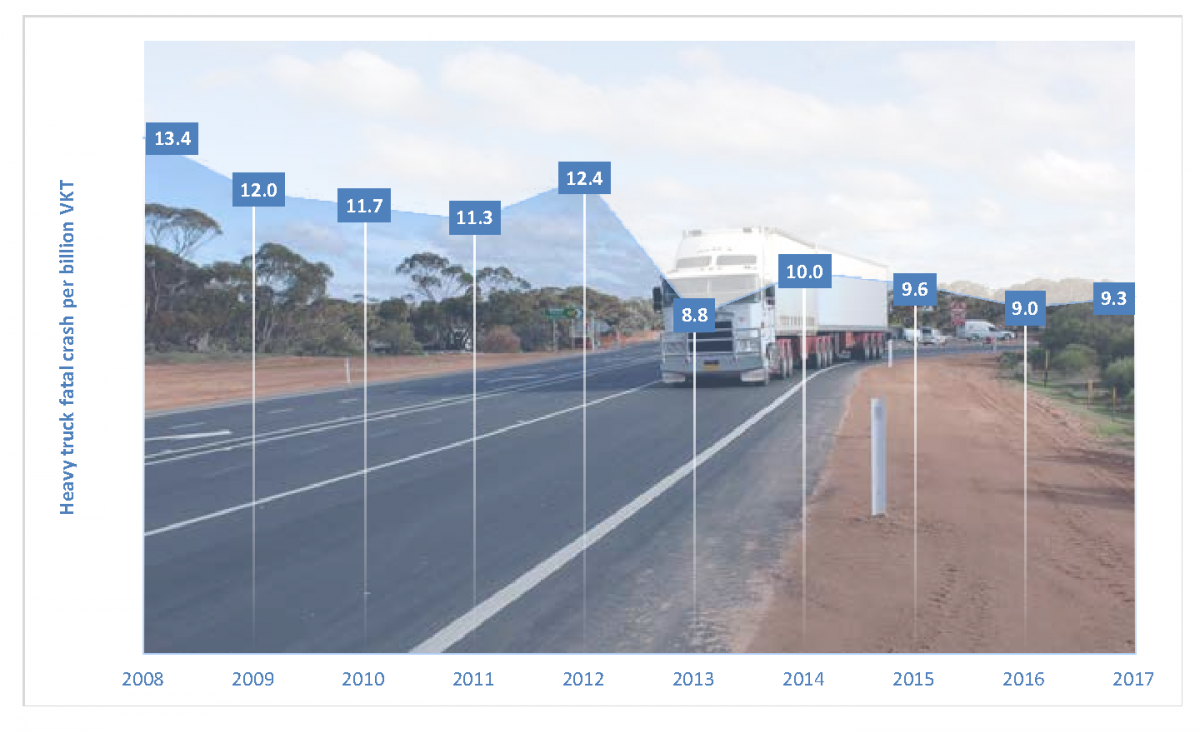
Figure 2.5: Heavy truck fatal crash per billion vehicle kilometres travelled (VKT)
For our freight systems to be resilient, they also have to be safe.
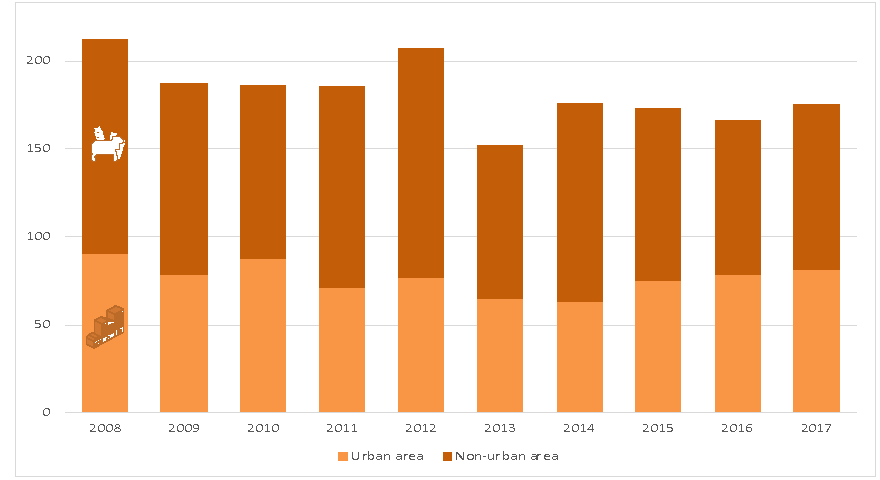
As Figures 2.5 and 2.6 show, progress has been made to reduce fatalities caused by crashes with heavy trucks. However, more action could be taken.
Latest heavy vehicle crash statistics reveal the vast majority of multi-vehicle fatalities involving a heavy vehicle in Australia are caused by cars.
Figure 2.6: Crashes involving heavy trucks by Significant Urban Area
Australia’s growing freight task brings with it many opportunities. To make the most of these, Australia’s freight and supply chains need to build resilience to meet changing consumer preferences and emerging issues associated with natural disasters and climate risk, security and cyber threats and increasing community expectations in relation to safety, security and environmental outcomes.

